# 셀프 주유소 가격 분포 그래프
import pandas as pd
from glob import glob # glob: 파일 목록을 뽑을 때 사용하는 모듈
import matplotlib.pyplot as plt
import seaborn as sb
from matplotlib import font_manager, rc
xls_files = glob('C:/oil/지역*.xls')
print(xls_files)
busan_raw = []
for file in xls_files:
raw = pd.read_excel(file, header=2)
busan_raw.append(raw)
busan_table = pd.concat(busan_raw) # concat: 동일한 인덱스나 컬럼을 가지고 있는 경우에 연속적으로 합치는 명령어
print(busan_table.head())
table = pd.DataFrame({'주유소':busan_table['상호'],
'주소':busan_table['주소'],
'가격':busan_table['휘발유'],
'셀프':busan_table['셀프여부'],
'상표':busan_table['상표']}) # 필요한 칼럼만 가져와 테이블 생성
print(table)
table['군/구'] = [address.split()[1] for address in table['주소']] # 주소 column 데이터 이용해 군/구 column 추가
print(table.head())
print(table['군/구'].unique())
table = table[table['가격'] != '-'] # 빈값(-) 제거
table['가격'] = [float(price) for price in table['가격']] # 가격 float으로 타입 변환
table.reset_index(inplace=True) # index 리셋 후 저장
del table['index'] # 리셋하면서 생긴 불필요한 'index' column 제거
print(table)
font_path = 'C:/Windows/Fonts/malgunbd.ttf' # 폰트 경로
font_name = font_manager.FontProperties(fname=font_path).get_name()
rc('font', family=font_name)
table.boxplot(column='가격', by='셀프', figsize=(12, 8)) # pandas boxplot은 x축이 by, y축이 column
plt.figure(figsize=(12, 8))
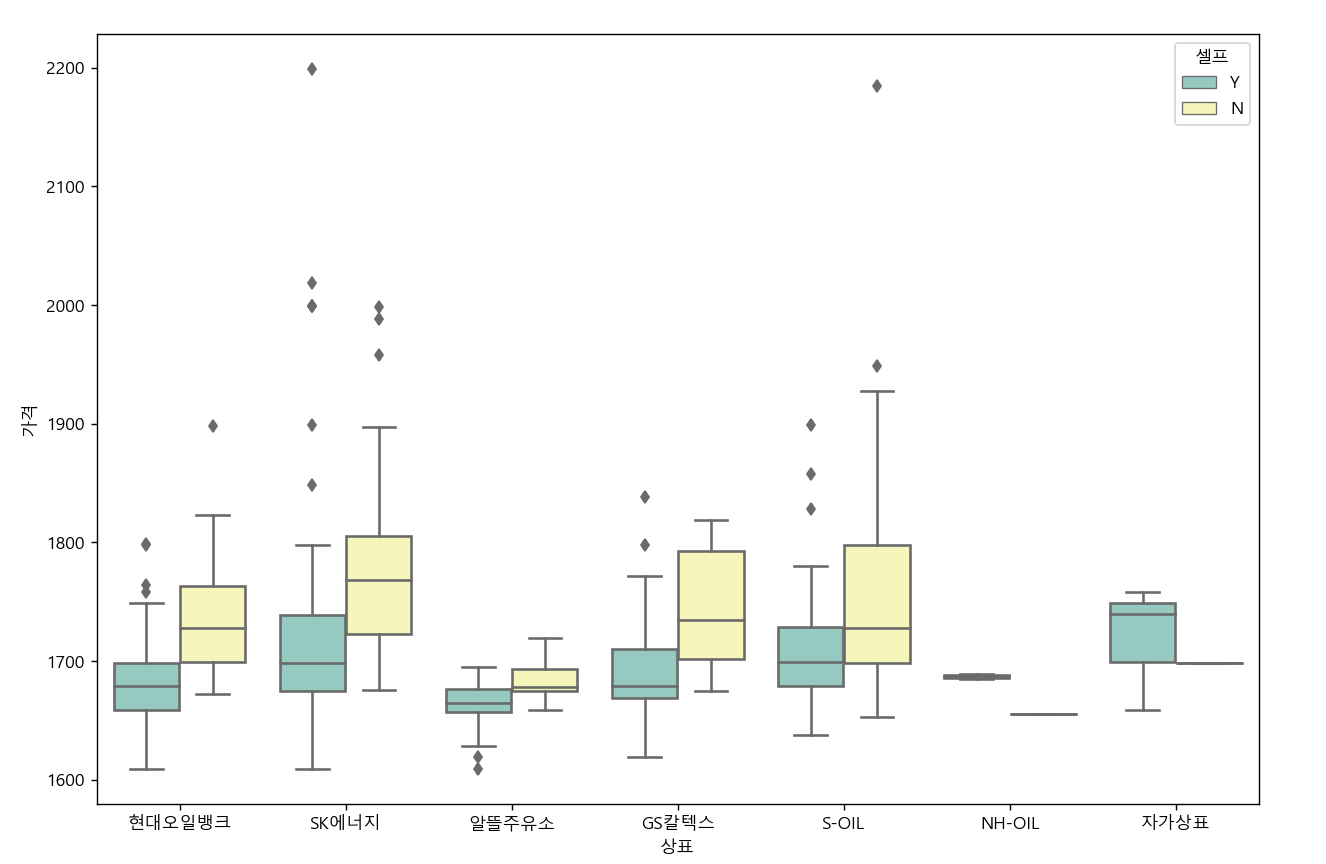
sb.boxplot(x='상표', y='가격', hue='셀프', data=table, palette='Set3')
plt.figure(figsize=(12, 8))
sb.boxplot(x='상표', y='가격', data=table, palette='bright')
sb.swarmplot(x='상표', y='가격', data=table, color='gray') # 박스
plt.show()
# folium를 이용한 군/구별 주유소 가격 분포 지도
import json
import folium
import warnings
import numpy as np
warnings.simplefilter(action='ignore', category=FutureWarning)
print(table.sort_values(by='가격', ascending=False).head(10)) # 가장 비싼 10곳
print(table.sort_values(by='가격', ascending=True).head(10)) # 가장 저렴한 10곳
goon_gu_data = pd.pivot_table(table, index=['군/구'], values=['가격'], aggfunc=np.mean) # 각 군/구별 가격 평균
print(goon_gu_data)
geo_path = 'C:/oil/busan.json'
geo_data = json.load(open(geo_path, encoding='cp949'))
map = folium.Map(location=[35.1209789, 129.11280680000004], zoom_start=10.5, tiles='OpenStreetMap')
map.choropleth(geo_data=geo_data, data=goon_gu_data, columns=[goon_gu_data.index, '가격'],
fill_color='YlOrBr', key_on='properties.SIG_KOR_NM')
map.save('busan_map.html')
# folium을 이용한 부산 기름값 상위 10곳 지도 및 하위 10곳 분포 지도
price_top10 = table.sort_values(by='가격', ascending=False).head(10)
price_bottom10 = table.sort_values(by='가격', ascending=True).head(10)
import geocoder # bing map에서 위도,경도 데이터를 추출하기 위해
bing_key = 'Aiydk3nEeyClRHaGHHuXXhMszPDk9bEtIaueXe2IyL83gpsRncbfcIV8ciMp1aNu'
latitude = []
longitude = []
for num in price_top10.index: # 상위 10개 지역 위도, 경도 리스트로 정리
gu = str(price_top10['주소'][num]).split('(')[0] # 주소에서 불필요한 부분 제거
tmp_map = geocoder.bing(gu, key=bing_key) # bing으로 위도, 경도 파악
lat = tmp_map.latlng[0]
long = tmp_map.latlng[1]
latitude.append(lat)
longitude.append(long)
price_top10['위도'] = latitude
price_top10['경도'] = longitude
print(price_top10)
latitude = []
longitude = []
for num in price_bottom10.index: # 하위 10개 지역 위도, 경도 리스트로 정리
gu = str(price_bottom10['주소'][num]).split('(')[0] # 주소에서 불필요한 부분 제거
tmp_map = geocoder.bing(gu, key=bing_key) # bing으로 위도, 경도 파악
lat = tmp_map.latlng[0]
long = tmp_map.latlng[1]
latitude.append(lat)
longitude.append(long)
price_bottom10['위도'] = latitude
price_bottom10['경도'] = longitude
print(price_bottom10)
map2 = folium.Map(location=[35.1209789, 129.11280680000004], zoom_start=10.5)
for n in price_top10.index: # 상위 10개 빨간 원으로 표시
folium.CircleMarker([price_top10['위도'][n], price_top10['경도'][n]], radius=15, color='red', fill_color='red').add_to(map2)
for n in price_bottom10.index: # 하위 10개 파란 원으로 표시
folium.CircleMarker([price_bottom10['위도'][n], price_bottom10['경도'][n]], radius=15, color='blue', fill_color='blue').add_to(map2)
map2.save('busan_map2.html') # 지도 파일은 보통 html 형식으로 저장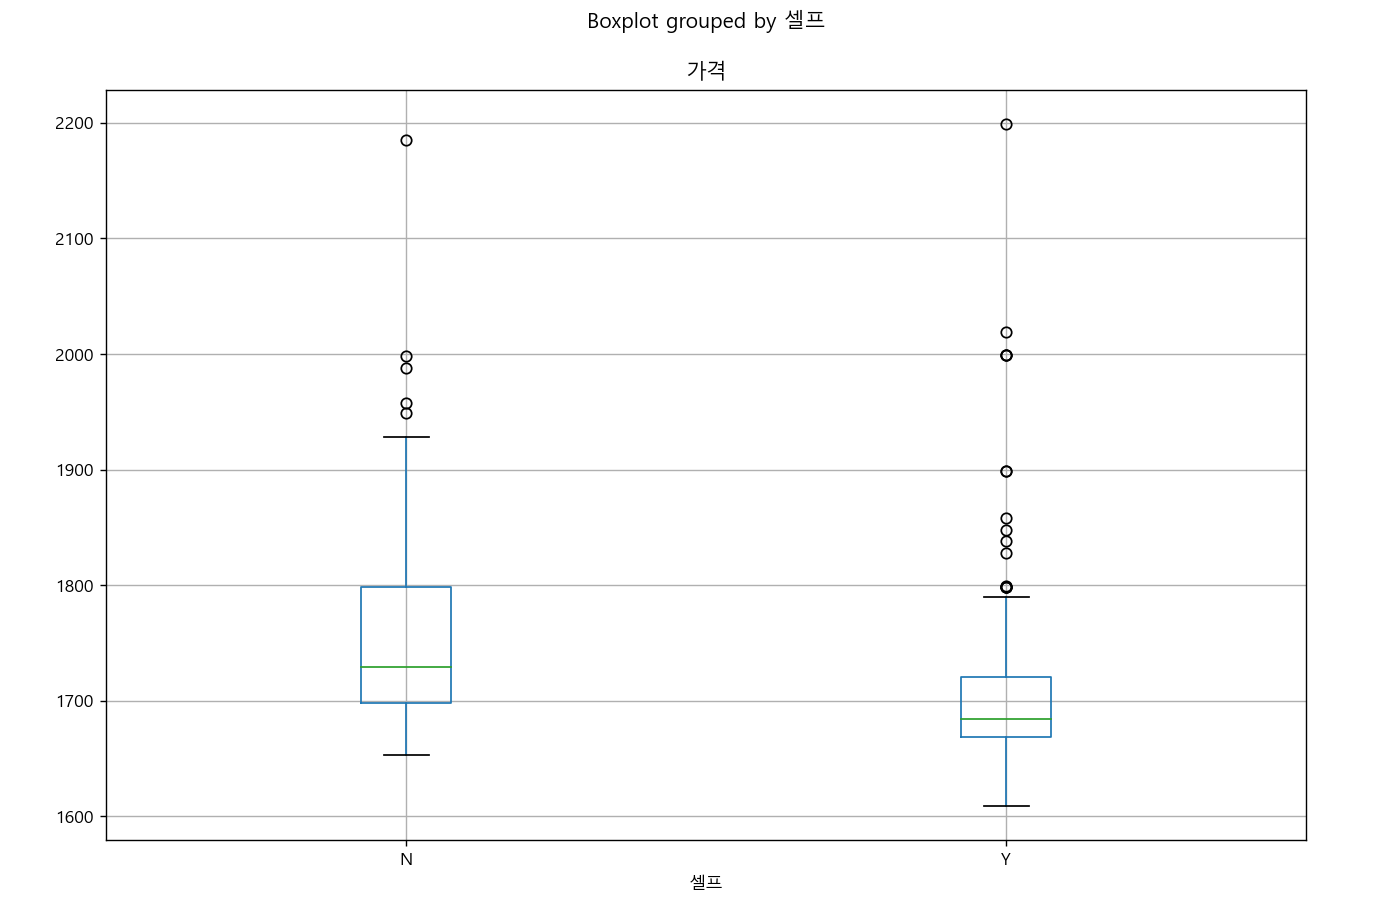
 busan_map.html
0.04MB
busan_map2.html
0.01MB
busan_map.html
0.04MB
busan_map2.html
0.01MB
# 지도위에 지역별로 텍스트가 표시되게 하려면 각 지역의 위도,경도 데이터를 받아서 적용시켜야 함
map = folium.Map(location=, zoom_start=, tiles=)
map.choropleth(geo_data=, data=, columns=, fill_color=, key_on=)
folium.map.Marker([위도,경도], icon=DivIcon(icon_size=(0,0), icon_anchor=(0,0),
html=스타일 및 출력할 텍스트 명령 입력)).add_to(map)
map.save('.html')
참고 : https://yeomss.tistory.com/281 (지도 위에 텍스트 입히기)
'빅데이터 부트캠프 > Crawling&Scraping' 카테고리의 다른 글
| 빅데이터 부트캠프 37일차 (0) | 2022.08.25 |
|---|---|
| 빅데이터 부트캠프 34일차 (0) | 2022.08.22 |
| 빅데이터 푸트캠프 17일차 (0) | 2022.07.26 |

댓글